Disruption Dashboard
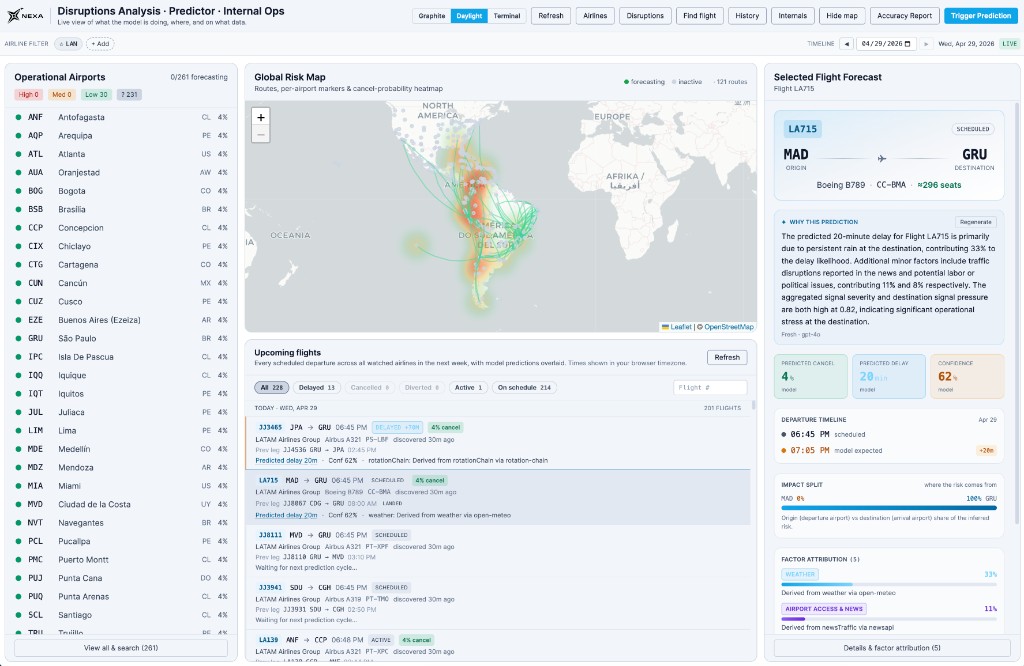
The Disruption Dashboard is the live, operational view of the predictor in the operations console. It's where on-call ops, airport operators, and supervisors see in one screen which flights are at risk, where the risk is concentrated, what the Nexa AI Model is predicting for any single flight, and why.
This guide walks through every panel of the dashboard. For the API surface behind the same data, see the Flight Disruption Predictor guide; for the architectural deep-dive see Inside the Flight Predictor.
Layout
The dashboard has three columns plus a top bar:
- Top bar — airline filter, timeline scrubber (with
LIVEtoggle), and quick actions (Refresh,Airlines,Disruptions,Find flight,History,Internals,Hide map,Accuracy Report,Trigger Prediction). - Left column — the operational airports list, segmented by current risk band.
- Center column — the Global Risk Map and the Upcoming Flights list with predictions inline.
- Right column — the Selected Flight Forecast panel.
The dashboard is LIVE by default — every panel is driven by the prediction event stream, so a fresh forecast reaches the screen within seconds of the model emitting it.
Operational airports panel
The left column lists every airport currently being forecast against, with the ICAO/IATA code, country, and the cancel-probability headline from the most recent prediction.
Airports are bucketed by risk band:
| Band | Threshold | Visual |
|---|---|---|
High | cancelProbability ≥ 0.6 and confidenceScore ≥ 0.7 | Red dot |
Med | 0.3 ≤ cancelProbability < 0.6 | Amber dot |
Low | cancelProbability < 0.3 with active forecasts | Green dot |
? | No fresh prediction in the configured window | Grey dot |
The header counters (High 0, Med 0, Low 30, ? 231) summarize the current state at a glance — the same airport list also drives the heatmap weights.
A search box and an explicit "View all & search" link expand the list when there are more airports than fit the panel.
Global risk map
The center map plots one marker per origin airport, colored by the same risk band, plus per-route arcs whose intensity reflects the highest cancelProbability over flights on that route in the next 24 hours.
A heatmap overlay sums signal severities by location — so a region under simultaneous weather + labor pressure shows up as a hotter cell, even before any single flight crosses the cancellation threshold. The legend in the upper right (Forecasting / Inactive / 121 routes) reflects the current scope.
Use the map for the "where is the risk" question; use the upcoming-flights list for the "which specific flights" answer.
Upcoming flights list
Below the map, the Upcoming Flights list shows every scheduled departure across all watched airlines for the next configurable window (default: one week), with model predictions overlaid inline.
For each flight the row shows:
- Airline group + flight number, scheduled departure, route (origin → destination), aircraft type / registration, time-since-discovery.
- Status badge:
SCHEDULED,DELAYED <Nm>,CANCELLED,DIVERTED,ACTIVE. - The cancel-probability badge (
4% cancel) and the predicted delay (Predicted delay 20m). - Confidence badge (
Conf 62%). - The top contributing factor (e.g. "weather: Derived from weather…" or "rotationChain: Derived from rotationChain…") so an operator can scan a list of 200 flights and immediately see which ones are weather-driven vs. rotation-driven vs. policy/operational.
Filter chips above the list let operators narrow by Delayed, Cancelled, Diverted, Active, or On schedule. Free-text search by flight number is also supported.
Selecting a row opens the Selected Flight Forecast panel on the right.
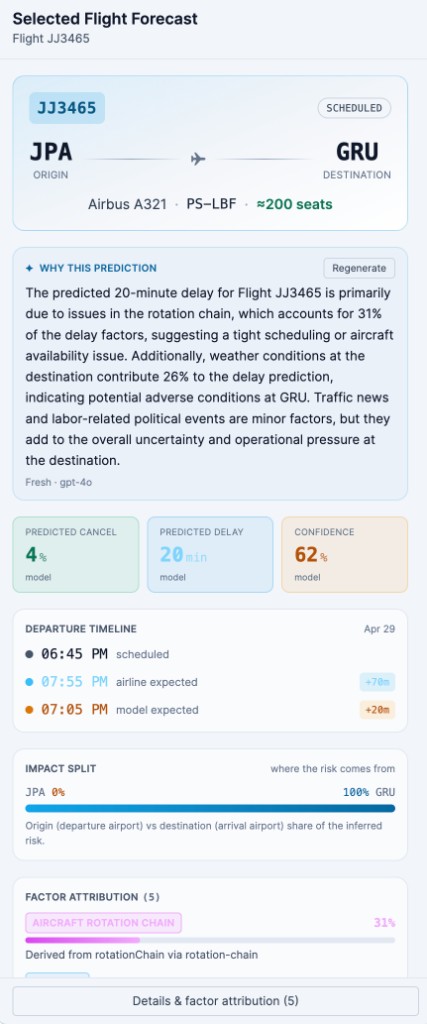
Selected flight forecast
The right-hand panel is the single-flight detail view. It's where an operator gets the full picture for a flight without leaving the dashboard.
Header
Flight number, status, origin/destination, aircraft type and registration, and seat count. The seat count drives the order-of-magnitude impact preview ("if this is cancelled, ~296 passengers need accommodation").
Why this prediction
A natural-language explanation generated by a Nexa Trained Model on Google, conditioned on the same factor attribution that drives the rest of the panel. It states the dominant contributors in plain English so a human can read it before drilling into the numbers.
The Regenerate button forces a fresh explanation against the latest factor mix. A freshness indicator below the text shows whether the explanation matches the current prediction snapshot.
Headline metrics
Three KPI tiles:
| Metric | What it is |
|---|---|
PREDICTED CANCEL | Calibrated probability that the flight cancels — pass through the classifier head. |
PREDICTED DELAY | Expected departure delay in minutes if the flight operates. |
CONFIDENCE | Heuristic coverage score (factor count + recency). Not a calibrated probability. |
All three are tagged with their source — model for trained-model predictions, baseline when the deterministic baseline produced the number.
Departure timeline
A compact timeline overlays three points on the same axis:
- The originally scheduled departure.
- The airline-expected departure (when the carrier has updated the schedule).
- The model-expected departure (
scheduled + predictedDelayMinutes).
This is the panel an operator looks at when the airline is publishing a different delay than the model expects — the divergence is itself a signal.
Impact split
A single bar showing where the inferred risk is coming from: origin airport vs. destination airport. A split like MAD 0% | 100% GRU tells the operator the destination is the constraint, not the origin — which changes how they should pre-stage hotel inventory.
Factor attribution
The ranked list of factors driving the forecast, with category, contribution percentage, and a short rationale string per factor.
Categories surfaced today:
- Weather — atmospheric pressure on origin and destination.
- Airport access & news — traffic and public events near the airports.
- Labor & political — strikes, civil unrest, regulatory pressure.
- Operational — airline-side reliability and flight-ops signals.
- Natural hazard — seismic and volcanic activity in the catchment area.
- Aircraft rotation chain — carry-over of delay from the previous leg of the same tail.
Attribution is computed independently of the model's inference. It exists to explain a forecast to a human, not to feed the model — so the model is never biased by the explanation it produces. The full breakdown ranks at most five categories per forecast.
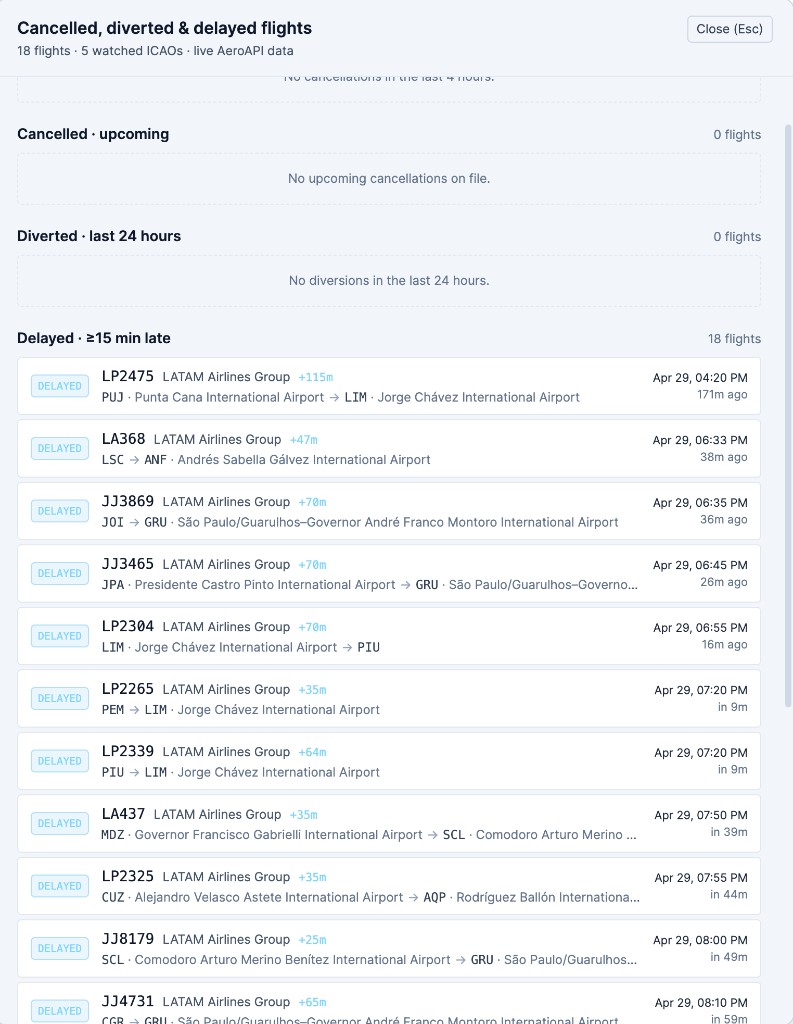
Cancelled, diverted & delayed flights
The Disruptions quick action opens a side panel summarizing what's already happening in real-time across watched ICAOs.
Sections:
- Cancelled · last 4 hours — flights that have actually cancelled in the last four hours.
- Cancelled · upcoming — flights flagged as cancelled in the schedule for the next 24 hours.
- Diverted · last 24 hours — flights that diverted; each divert generates a synthetic origin signal so neighboring flights pick up the disruption laterally.
- Delayed · ≥15 min late — every flight currently more than 15 minutes late, with the IATA on-time threshold applied.
Each row shows airline group, route, scheduled departure, time-since-discovery, and the magnitude of the delay (+115m, +47m, +70m, …). Clicking a row jumps to that flight in the main forecast panel.
The header reflects the live data scope (18 flights · 5 watched ICAOs · live data).
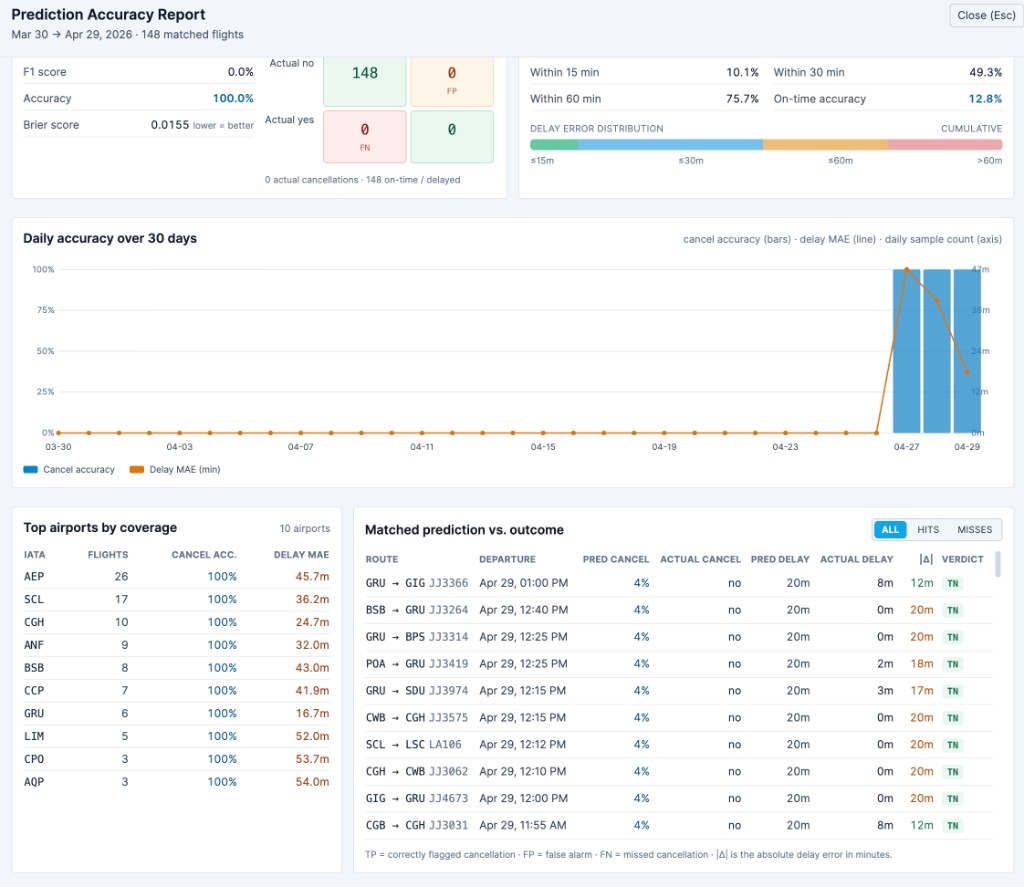
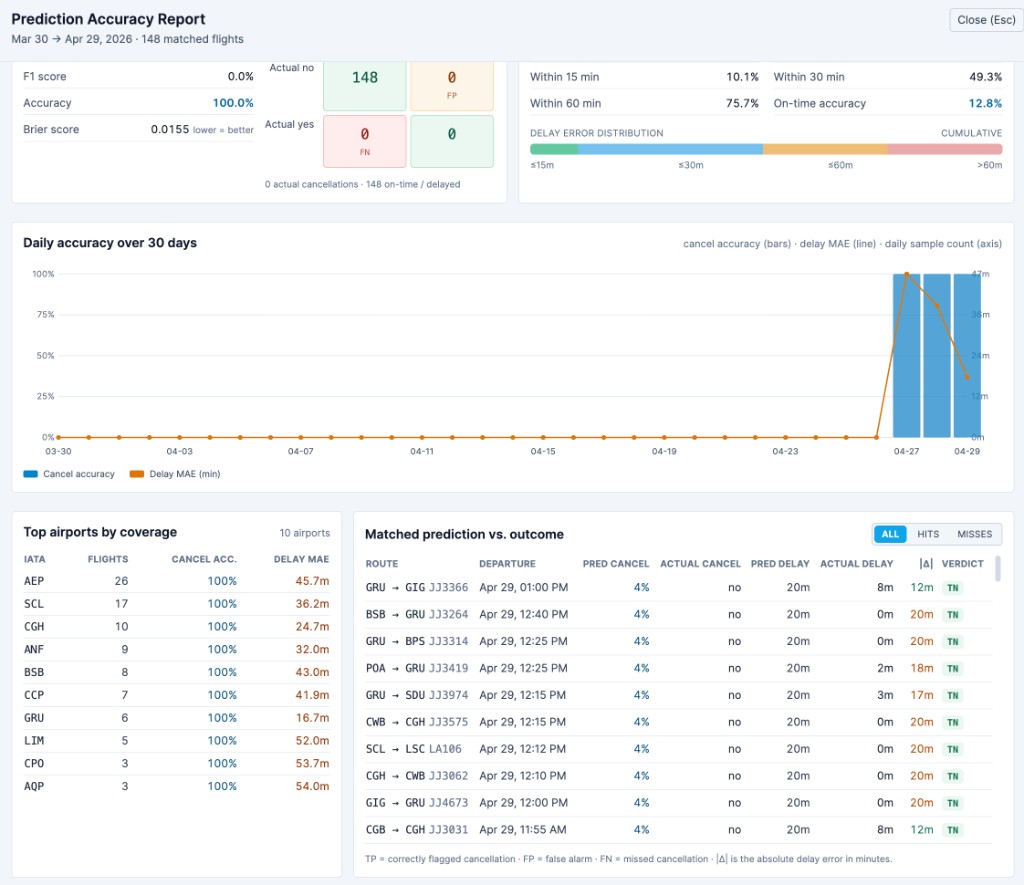
Prediction accuracy report
The Accuracy Report quick action opens the model-quality dashboard. This is the panel that answers "is the predictor still good?" with strict no-look-ahead matching.
Window selector
7 days, 14 days, 30 days, 60 days, 90 days. The window applies to every panel below it; the date range and matched-flight count are echoed in the page title (e.g. "Mar 30 → Apr 29, 2026 · 148 matched flights").
Headline KPIs
| Tile | Meaning |
|---|---|
CANCEL ACCURACY | Accuracy of the classifier head at the configured threshold (default 0.5). |
DELAY MAE | Mean absolute error of the delay head (and RMSE + bias below as supporting numbers). |
ON-TIME CLASSIFIER | Accuracy at the IATA on-time threshold (≥15 min late as the on-time call). |
MATCHED COVERAGE | Fraction of outcomes that had a preceding prediction (predictionsBefore / totalOutcomes). |
Cancellation classifier
A confusion matrix (TP / FP / FN / TN) plus precision, recall, F1, accuracy and Brier score. The confusion matrix uses the exact threshold shown next to the panel title, so dragging the threshold in the operator UI re-derives the metrics live.
Delay regression
For non-cancelled flights:
- MAE and RMSE in minutes.
- Bias (
mean(predicted − actual)) flagged asover-predicting/under-predicting. - Median |err|.
- Within 15 / 30 / 60 minutes — fraction of forecasts that landed in each error band.
- On-time accuracy at the IATA threshold.
- A delay error distribution bar (
≤15m,≤30m,≤60m,>60m) — quick visual check of the long tail.
Daily accuracy
A combined chart over the selected window: cancel accuracy as bars, delay MAE as a line, daily sample count behind the bars. Useful for catching drift — a sudden divergence between the line and the bars means the cancel head is still fine but the delay head started skewing, or vice versa.
Top airports by coverage
The airports with the most matched flights in the window, sorted by coverage. Each row shows IATA, flight count, cancel accuracy, and delay MAE. Patterns at this level (one airport consistently high MAE, others low) usually point at a route-specific signal source that needs a reload.
Matched prediction vs. outcome
A flight-by-flight breakdown:
| Column | Meaning |
|---|---|
ROUTE | Origin → destination + flight number. |
DEPARTURE | Scheduled departure used for the no-look-ahead match. |
PRED CANCEL | Predicted cancel probability (most recent forecast before scheduled_out). |
ACTUAL CANCEL | Outcome flag: yes / no. |
PRED DELAY | Predicted delay in minutes. |
ACTUAL DELAY | Observed delay in minutes. |
|Δ| | Absolute delay error. |
VERDICT | TP / FP / FN / TN for the cancel head. |
The ALL / HITS / MISSES toggle flips the table to show only correct or only incorrect calls — typically the first place an operator looks when something feels off. Hits are confirmed cancellations the model flagged in time; misses are false alarms or the rarer (and worse) missed cancellations.
Tips for operators
- The risk band in the airports panel and the cancellation badge in the flights list use the same
cancelProbability × confidenceScorethresholds the platform uses internally for pre-warming. If a flight isHighhere, the platform is already pre-warming hotel inventory for it. - The rotation chain factor often appears before any external signal does — when a leg of the same tail is running 70 minutes late, the model carries roughly 40% of that into the next leg even without weather, news or labor pressure.
- The impact split is the cleanest single check on whether you should pre-stage at the origin or at the destination. A 100/0 destination split means the constraint is downstream — the inventory you want held is at the destination city, not the origin.
- The
MATCHED COVERAGEnumber on the Accuracy Report is the most operationally important quality metric — a low coverage rate means the predictor was unreachable for a large fraction of flights and the precision/recall numbers below it are computed on a reduced sample. Coverage should sit comfortably above 95% in steady state.
See also
- Flight Disruption Predictor — API guide — the same data over HTTP.
- Inside the Flight Predictor — multi-agent layer, 14-feature snapshot, deterministic baseline, model heads.
- Exception Agent — what happens when allocation can't auto-resolve a case the predictor warned about.